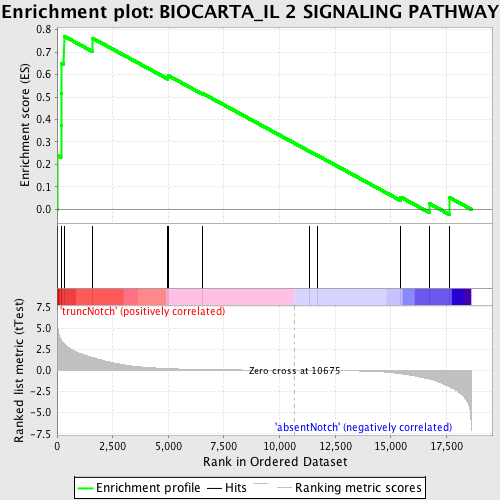
Profile of the Running ES Score & Positions of GeneSet Members on the Rank Ordered List
| Dataset | Set_03_absentNotch_versus_truncNotch.phenotype_absentNotch_versus_truncNotch.cls #truncNotch_versus_absentNotch |
| Phenotype | phenotype_absentNotch_versus_truncNotch.cls#truncNotch_versus_absentNotch |
| Upregulated in class | truncNotch |
| GeneSet | BIOCARTA_IL 2 SIGNALING PATHWAY |
| Enrichment Score (ES) | 0.77097094 |
| Normalized Enrichment Score (NES) | 1.513566 |
| Nominal p-value | 0.02 |
| FDR q-value | 0.37601253 |
| FWER p-Value | 0.999 |
| PROBE | DESCRIPTION (from dataset) | GENE SYMBOL | GENE_TITLE | RANK IN GENE LIST | RANK METRIC SCORE | RUNNING ES | CORE ENRICHMENT | |
|---|---|---|---|---|---|---|---|---|
| 1 | IL2RA | 6620450 | 8 | 6.074 | 0.2396 | Yes | ||
| 2 | HRAS | 1980551 | 175 | 3.618 | 0.3737 | Yes | ||
| 3 | JAK3 | 70347 3290008 | 183 | 3.588 | 0.5152 | Yes | ||
| 4 | STAT5A | 2680458 | 210 | 3.478 | 0.6512 | Yes | ||
| 5 | IL2RB | 4730072 | 309 | 3.163 | 0.7710 | Yes | ||
| 6 | LCK | 3360142 | 1591 | 1.510 | 0.7618 | No | ||
| 7 | STAT5B | 6200026 | 4979 | 0.210 | 0.5880 | No | ||
| 8 | JAK1 | 5910746 | 4994 | 0.207 | 0.5954 | No | ||
| 9 | SOS1 | 7050338 | 6527 | 0.096 | 0.5169 | No | ||
| 10 | IL2 | 1770725 | 11344 | -0.011 | 0.2585 | No | ||
| 11 | SYK | 6940133 | 11709 | -0.018 | 0.2396 | No | ||
| 12 | SHC1 | 2900731 3170504 6520537 | 15440 | -0.398 | 0.0549 | No | ||
| 13 | IL2RG | 4120273 | 16729 | -1.019 | 0.0259 | No | ||
| 14 | GRB2 | 6650398 | 17634 | -1.909 | 0.0528 | No |

